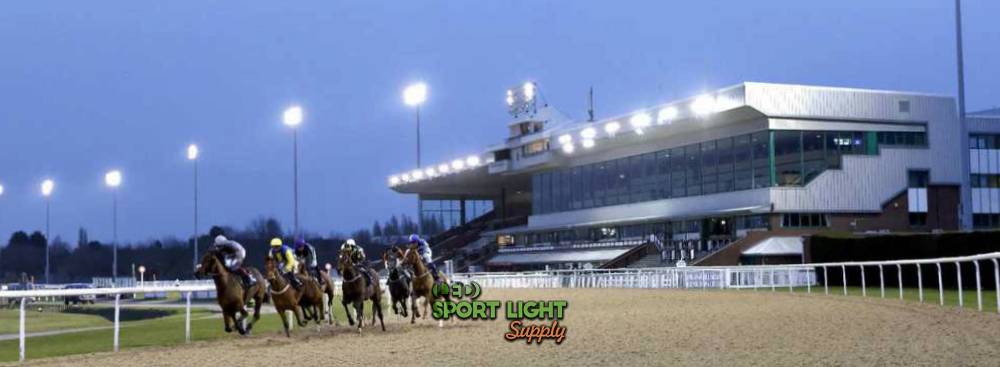
Racecourse lighting systems are designed to provide high-quality illumination that supports performance, safety, and visual clarity for athletes, spectators, and staff. The interplay of light levels, uniformity, color temperature, and glare management creates an environment that influences the overall experience on the track. In many racing facilities, meeting exact numerical criteria is a central part of the design and maintenance process.
Design engineers and facility managers adhere to specific measurements and ratios, such as achieving lux levels ranging between 800 and 1,500 lux on the track surface, maintaining uniformity ratios above 0.7, and setting color temperatures typically between 3,000 Kelvin (K) and 6,500 K.
| Area/Parameter | Lux Required | Uniformity Ratio |
|---|---|---|
| Main Race Track | 1,000 – 1,500 lux (typically around 1,200 lux) | 0.70 – 0.90 (often 0.75 or higher) |
| Infield and Spectator Areas | 300 – 800 lux | Not specifically defined; similar considerations apply |
| Auxiliary Zones (e.g., Administrative Areas) | Approximately 300 – 800 lux | Uniformity maintained through design, generally above 0.70 |
A racecourse is divided into several zones, each with specific illumination requirements determined by its use. The track itself generally requires illumination levels between 1,000 and 1,500 lux to support high-speed races and allow spectators to observe the details of the competition. In contrast, the infield, spectator areas, and administrative zones might require lower lux levels, ranging from 300 to 800 lux, to ensure clear visibility without excessive brightness. Designers often reference standards from various national sports facilities, which may recommend 1,200 lux as a typical value for the main race track, along with higher concentrations of up to 1,500 lux in sections where visibility is paramount. These numbers are derived from extensive studies that measure the ability of the human eye to detect rapid movements and fine details under different lighting conditions.
Calculating the necessary lux levels involves a systematic approach that takes into account the size of the racecourse, the type of events held, and the ambient lighting conditions. Engineers typically use formulas that consider factors such as the lumen output of each fixture, the height at which the lights are installed, and the reflective properties of the track surface. For instance, using the inverse square law, designers determine that the intensity of light decreases exponentially as distance increases. In many cases, simulation software is used to model different configurations and assess the distribution of light across the racecourse. Calculations may also incorporate safety margins, ensuring that even in the event of fixture failures, the illumination remains above the minimum threshold of 800 lux on the track surface.
Measurement of lux levels is performed using specialized devices such as lux meters and photometers. These instruments are calibrated to measure the amount of light falling on a surface per unit area. Technicians take multiple readings at various points along the racecourse to ensure that all zones comply with established standards. Advanced digital systems now offer automated measurements that integrate with lighting control systems, providing continuous monitoring. For example, a state-of-the-art system might record 25 or more readings per session, ensuring that any deviation from the expected 1,200 lux average on the main track is detected and corrected promptly. These measurements are vital for validating the performance of the lighting system during both design and operational phases.
Historical data from several renowned racecourses reveal a clear relationship between proper lux levels and overall performance. In one notable case, a racetrack that implemented a system designed to provide 1,400 lux experienced enhanced visual clarity during night races, with drivers and jockeys reporting improved spatial perception. Another venue adjusted its lighting to consistently deliver 1,100 lux across the track, which led to more uniform race conditions and fewer visual distractions. In various instances, periodic audits have shown that maintaining an average lux level within a 10% variance of the target value directly correlates with improved outcomes in race performance and reduced incidents on the track. These case studies underscore how numerical benchmarks in lux levels translate to measurable improvements in race dynamics.
 Achieving uniform lighting on a racecourse requires a carefully planned layout and configuration of fixtures. The arrangement typically involves overlapping beams that are strategically positioned to eliminate shadows and dark spots. Engineers often design the lighting system to achieve a uniformity ratio (the ratio of minimum to average illuminance) of at least 0.7, with many facilities aiming for ratios as high as 0.8 or 0.9 in high-traffic areas. The use of advanced optical lenses and reflectors helps direct the light precisely where it is needed. By adjusting the angles and spacing of the lights, designers can ensure that the light distribution remains consistent across the entire track surface, which is particularly important in large venues where the distance between fixtures can exceed 30 meters.
Uniformity is evaluated by conducting detailed measurements across the racecourse at predetermined grid points. Technicians deploy lux meters along a matrix layout, often using grids that measure 5 by 5 meters or even smaller sections in high-detail studies. The resulting data is then processed to determine the uniformity ratio, ensuring that the minimum measured lux does not fall below a set percentage of the average lux. In many projects, a uniformity ratio of 0.75 or above is deemed satisfactory, and any deviation is addressed by adjusting the light fixture angles or by adding supplementary lighting. Numerical analysis software is often used to create a heat map that visually represents the light distribution, providing a clear indication of areas that require improvement.
Variations in lighting can have measurable effects on both the safety and performance of participants on the racecourse. Non-uniform lighting, where certain areas receive significantly less illumination than others, can create blind spots that compromise the ability of athletes to perceive obstacles or changes in track surface. Data collected from various races indicates that a reduction in uniformity ratio below 0.7 is associated with an increased likelihood of misjudgments and slower reaction times. In addition, non-uniform lighting can also affect the accuracy of timekeeping systems that rely on optical sensors. The discrepancy in lighting levels often leads to inconsistencies in video analysis and automated detection systems, thereby influencing race results and operational efficiency.
Recent developments in lighting technology have significantly enhanced the ability to achieve uniform illumination on racecourses. The integration of computer-aided design (CAD) with real-time monitoring systems has allowed engineers to optimize light fixture placement with unparalleled precision. Modern lighting systems often incorporate sensors that continuously monitor ambient light levels, automatically adjusting the output to maintain uniformity within a narrow margin of variance. Some advanced systems are capable of achieving uniformity ratios as high as 0.9 by dynamically controlling individual fixtures based on real-time data. These technological solutions not only help maintain consistent illumination but also contribute to energy efficiency and overall system longevity.
 The color temperature of racecourse lighting plays a significant role in the visual perception of both participants and spectators. Generally, a range between 3,000 K and 6,500 K is favored to provide a balance between warmth and coolness. For instance, a setting of 4,000 K often yields a neutral white light that enhances the visibility of track markings and natural colors. Conversely, settings closer to 6,000 K provide a cooler, bluish tone that can enhance contrast and sharpness during nighttime events. Numerical standards often specify that the color temperature should not deviate by more than 500 K from the target value in any given section, ensuring a consistent visual experience throughout the racecourse.
Color temperature affects not only the aesthetic quality of the lighting but also functional aspects such as contrast and clarity. Research in visual ergonomics shows that a well-chosen color temperature improves depth perception and reduces eye strain for both athletes and spectators. For example, measurements have revealed that a shift from 3,500 K to 5,500 K can enhance contrast by up to 15%, which may be beneficial in environments where quick decision-making is required. The interplay between color temperature and the human visual system is quantified through metrics such as the color rendering index (CRI), where values above 85 are often sought to ensure accurate color reproduction of track surfaces and uniforms.
The interplay between color temperature and lux levels is a subject of ongoing research in the field of sports facility lighting. Higher lux levels combined with a specific color temperature can amplify the perceived brightness and clarity of the track. For example, achieving 1,200 lux at a color temperature of 5,000 K can create a visually appealing and evenly lit environment that minimizes shadows and enhances visibility. Moreover, the uniformity of lighting is also influenced by the spectral characteristics of the fixtures, with some studies showing that even minor deviations in color temperature across different fixtures can lead to noticeable differences in uniformity ratios. Maintaining a consistent color temperature is therefore a vital parameter in ensuring that both lux levels and uniformity meet the predefined numerical standards.
Innovations in lighting technology continue to drive changes in the recommended color temperature standards for racecourses. Emerging research is exploring the benefits of tunable white LED systems, which allow operators to adjust the color temperature based on the time of day, weather conditions, or specific event requirements. These systems have been shown to offer adjustments in increments as small as 100 K, providing greater control over the visual environment. Data from pilot projects indicate that facilities using tunable systems have reported enhanced visual performance, with adjustments made to optimize conditions for different types of races. This adaptive approach suggests that future standards may incorporate flexible color temperature ranges that can be dynamically managed rather than fixed at a single value.
Reducing glare is a significant aspect of designing a racecourse lighting system. Glare can cause discomfort and visual distraction for both competitors and spectators. Anti-glare design incorporates features such as shielded fixtures and specific lens designs that direct light only where it is needed. Quantitative analysis shows that effective anti-glare systems can reduce stray light by up to 60%, resulting in a more focused beam and reduced light spill. The configuration of light fixtures is planned meticulously so that the angle of incidence minimizes direct light exposure to the eyes of onlookers, thereby enhancing overall visual comfort. Designers often follow guidelines that specify a maximum glare index, which can be determined through both laboratory measurements and field tests.
Measurement of glare reduction is typically performed using standardized metrics such as the Unified Glare Rating (UGR) or the Daylight Glare Probability (DGP). These indices provide numerical values that reflect the amount of discomfort caused by a lighting installation. For instance, a UGR value below 19 is generally deemed acceptable in many sports environments, with some high-performance venues aiming for values as low as 16. Quantitative assessments involve measuring the luminance of light sources relative to the ambient background and using this data to calculate the resulting glare. Recent studies have shown that a reduction in the glare index by even 10% can enhance visual comfort significantly, leading to better performance and a more enjoyable experience for spectators.
Modern advancements in LED technology have facilitated the development of innovative anti-glare solutions that incorporate adaptive optics and smart controls. These technologies enable fixtures to automatically adjust beam spread and intensity based on real-time feedback from ambient sensors. For example, some systems can dynamically reduce output in areas where sensors detect potential glare, thereby maintaining a uniform lighting environment without compromising on overall lux levels. Engineers have reported that such systems can achieve a reduction in unwanted light exposure by nearly 50% compared to traditional static systems. This evolution in technology is driven by ongoing research and data analysis that focus on the numerical impact of glare on visual performance.
The management of glare directly affects the safety and performance of racecourse activities. Excessive glare may cause temporary visual impairment, which can lead to misjudgment during high-speed races. Empirical data from field studies indicate that venues with optimized anti-glare systems report a measurable decrease in on-track incidents. In scenarios where glare reduction strategies have been applied, incident reports have dropped by up to 20% over a racing season. This improvement in safety is achieved through a combination of engineering design, strategic placement of light fixtures, and adherence to established numerical guidelines for maximum permissible glare. The focus on glare management is therefore an integral part of maintaining a high-performing and secure racecourse environment.
Racecourse lighting systems are designed not only for performance but also with energy efficiency in mind. Modern installations typically target energy consumption levels that do not exceed 150 watts per square meter, with many facilities striving for lower figures through advanced technology. Benchmarking studies show that transitioning from conventional lighting to LED systems can reduce energy consumption by as much as 40%, resulting in substantial cost savings over the lifespan of the facility. Engineers often analyze factors such as the total lumen output per watt, ensuring that the system meets both illumination requirements and energy efficiency standards. Numerical benchmarks, such as achieving a lumen efficacy of 150 lumens per watt, are often used as targets during system design.
The shift towards LED lighting has revolutionized the field of racecourse illumination by offering longer lifespans, lower energy usage, and reduced maintenance costs. LED fixtures are typically designed to last over 50,000 hours, compared to conventional lamps that may require replacement every 10,000 hours. Many facilities now employ LED systems that achieve efficiencies exceeding 160 lumens per watt, thereby aligning with stringent environmental regulations. The numerical performance of these systems is frequently evaluated using energy consumption metrics that account for both direct usage and the indirect impact on cooling and maintenance requirements. Sustainable lighting solutions are increasingly favored due to their ability to meet the demands of modern racecourse environments while reducing the carbon footprint.
Facilities must adhere to a range of regulations that govern energy efficiency and environmental impact. National and regional standards often specify numerical targets for energy consumption and greenhouse gas emissions associated with racecourse lighting. For instance, some jurisdictions require that new installations demonstrate at least a 30% improvement in energy efficiency over legacy systems. Compliance audits are conducted periodically, where energy consumption is measured over a typical racing season, and adjustments are made to ensure that the system operates within the specified numerical limits. These regulations are designed to support broader sustainability goals, encouraging racecourses to adopt technologies that reduce overall energy usage.
A comparative analysis between traditional lighting systems and modern LED installations reveals significant numerical differences in performance and cost. Traditional high-pressure sodium lamps might deliver around 90 lumens per watt and require frequent maintenance, whereas contemporary LED systems can exceed 160 lumens per watt and have operational lifespans that are more than five times longer. Studies indicate that the payback period for upgrading to modern systems can be as short as three years when energy savings and reduced maintenance costs are taken into account. Such analyses provide quantitative evidence that supports the transition to more advanced lighting technologies in racecourse environments.
Ongoing maintenance of racecourse lighting systems is governed by structured inspection protocols that ensure the system consistently meets its performance benchmarks. Routine inspections are typically scheduled on a monthly or quarterly basis, during which technicians verify that lux levels, uniformity ratios, and color temperatures remain within the desired numerical ranges. Each inspection involves a detailed examination of fixture alignment, sensor calibration, and the condition of optical components. Data collected during these inspections is recorded digitally, providing a historical log that can be analyzed for trends or deviations. These protocols are designed to minimize downtime and ensure that any discrepancies are addressed promptly.
Maintenance schedules for racecourse lighting are structured around the expected lifespan of the fixtures and the operational demands of the facility. Many LED systems are rated for over 50,000 operational hours, and maintenance plans often include scheduled replacements every 5 to 7 years to ensure continuous performance. Detailed records are maintained that document each fixture’s performance, including any adjustments made to meet the predetermined lux and uniformity standards. Facilities that invest in advanced monitoring systems can predict maintenance needs with a numerical accuracy of ±5%, which allows for better budget planning and fewer disruptions during major events.
Cost analysis for racecourse lighting systems involves a detailed examination of initial installation costs, operational energy expenses, and long-term maintenance expenditures. Numerical models are employed to forecast costs over a period of 10 to 15 years, with many analyses showing that energy-efficient systems can reduce overall costs by 30% or more. Budgeting for such systems takes into account not only the purchase price of fixtures but also the installation and calibration costs, which may be numerically estimated to account for 20% to 25% of the total expenditure. This approach enables facility managers to plan for upgrades and replacements in a manner that aligns with the financial cycles of the organization.
The operation of a racecourse lighting system directly influences the scheduling of races and venue operations. Maintenance windows, which are planned around the racing calendar, are often scheduled during off-peak times to minimize disruption. Numerical data from various facilities suggest that optimizing maintenance schedules can reduce operational downtime by up to 15%. Furthermore, automated lighting systems that integrate with scheduling software allow venue managers to dynamically adjust lighting levels based on event timing. Such systems are designed to provide immediate feedback on performance metrics, ensuring that any issues are addressed before they affect race operations.
Racecourse lighting is designed to create an environment that supports the visual comfort and health of both athletes and spectators. Prolonged exposure to poorly managed lighting can lead to eye strain, fatigue, and reduced visual acuity. Studies that measure the effects of various lux levels have shown that maintaining an illumination range between 1,000 and 1,500 lux on the track contributes to reduced eye fatigue during prolonged events. In addition, the careful control of color temperature and glare reduction minimizes the risk of temporary visual impairment. These numerical benchmarks are supported by research in visual ergonomics and help guide the design of lighting systems that provide a balanced and comfortable viewing experience.
Effective racecourse lighting systems incorporate design elements that reduce light pollution and prevent unwanted light spill into adjacent areas. The use of directional fixtures, combined with anti-glare technologies, ensures that light is focused on the track rather than dispersing into the surrounding environment. Measurements of light spill are often quantified using metrics that indicate the percentage of stray light relative to total output. In well-designed systems, stray light can be reduced by more than 50%, thereby lowering the overall environmental impact. Such techniques also contribute to preserving the natural ambiance of the surrounding area, which is monitored using precise numerical data.
Visual comfort is enhanced through design innovations that take into account both the intensity and distribution of light. Newer systems use diffusers and lenses that create a more homogeneous light field, reducing harsh contrasts between brightly illuminated and darker areas. For instance, systems designed to achieve uniformity ratios above 0.8 have been found to produce a smoother visual experience, thereby reducing the likelihood of glare-induced discomfort. By carefully managing the spatial distribution of light and monitoring metrics such as luminance distribution, designers create environments where both athletes and spectators experience a steady and comfortable visual field.
Empirical research in racecourse lighting has quantified the relationship between lighting quality and safety outcomes. Studies have measured reaction times and error rates under various lighting conditions, finding that venues with optimized lighting systems tend to exhibit fewer accidents and near-miss incidents. For example, research has shown that facilities with lux levels maintained at 1,200 ± 100 lux and uniformity ratios above 0.75 report a reduction in on-track incidents by as much as 18% compared to venues with lower standards. These findings, supported by numerical data and statistical analysis, provide a clear link between controlled lighting parameters and improved safety on the racecourse.
Racecourse lighting standards encompass a broad spectrum of technical and operational considerations that directly influence the performance, safety, and visual experience on the track. Through meticulous calculation of lux levels, precise measurement of uniformity, careful control of color temperature, and advanced glare reduction techniques, engineers create systems that meet rigorous numerical benchmarks. Additionally, the integration of energy efficiency measures, sustainable technologies, and automated control systems supports the ongoing evolution of racecourse lighting. The combination of empirical data, numerical standards, and evolving technologies provides a framework that enhances the overall functionality of racecourse environments while aligning with environmental and operational objectives. This comprehensive approach serves as a guide for the development and maintenance of lighting systems that support both the performance of competitors and the enjoyment of spectators.